Exploring customer segments and predicting customer response
Customer Segmentation Report for Bertelsmann Arvato Financial Solutions

Introduction
This post is part of the Udacity Data Scientist Nanodegree Capstone Project provided in collaboration with Bertelsmann Arvato Analytics.
In this project unsupervised and supervised learning, models were used to analyze the demographics of the general population in Germany against demographics data of customers of a German mail-order company.
The purpose of this post is to explain how these techniques were used to identify segments of the population that best describe the core customer base of the company as well as predict customer response to a marketing campaign.
This project builds on real-life data captured by Arvato. Included in the project were four datasets and two CSV files describing some of the features:
- Azdias — Demographics data for the general population of Germany (891 211 x 366).
- Customers — Demographics data for customers of the German mail-order company (191 652 x 369).
- Mailout_train (train) — Demographics data for individuals who were targets of a marketing campaign (42 982 x 367).
- Mailout_train (test) — Demographics data for individuals who were targets of a marketing campaign (42 833 x 366).
The two CSV files contain information about some of the features in the datasets (type, missing value codes, explanations of what the values mean).
Problem Statement
According to Senior Key Account Manager Time Reis, the problem statement was:
How can their client, a mail-order company, acquire new clients more efficiently?
The project was divided into three distinct parts to make them more manageable:
- Data Preprocessing — The first part was all about performing preprocessing steps to make data ready for further analysis. This involved converting missing value codes to NaN’s, analyzing missing values per column and row, and some feature engineering.
- Identify customer segments within the general population — The second part aimed to help the company create a more efficient way of targeting people who are more likely to become customers. This was done by comparing the customer demographics data against general population demographics data. Using the principal component and unsupervised techniques different segments were created which in turn made it possible to identify parts of the population that best described the core customer base of the German company.
- Predict customer response rate — The motivation for the third part was to create a machine learning model that could be used to predict whether or not a person would respond to a marketing campaign. As a final part, the best model was submitted to Kaggle to see how it stacked up against models created by other users.
By following the steps outlined above we could hopefully help the company increase the efficiency of its customer acquisition process. A process that first identifies likely customers and then targets those individuals that are more prone to respond, with advertising, would probably give a better result than reaching out to all/random people living in Germany.
Analysis and Discussion
Data Preprocessing
As we already know that we have about 366 columns. So first I remove the columns in which I do not have any detail about features.
Then I have removed columns in which the number of nans is greater than 20 and at last, I just find the correlation between columns and remove columns that have more than 0.7 correlation coefficient.
Finally, I have handled categorical columns, and just by using get dummies function I just encode them.
After doing all these steps I just left with 183 columns.
Identify customer segments within the general population
So after data processing, I just want to reduce the amount of the columns so for this I want to use PCA i.e. Principal Component Analysis.
To use PCA we should always Normalize our data. So first I normalize the data using Standard Scaler.
So after scaling I want to apply PCA. So for this, I apply a scree plot.
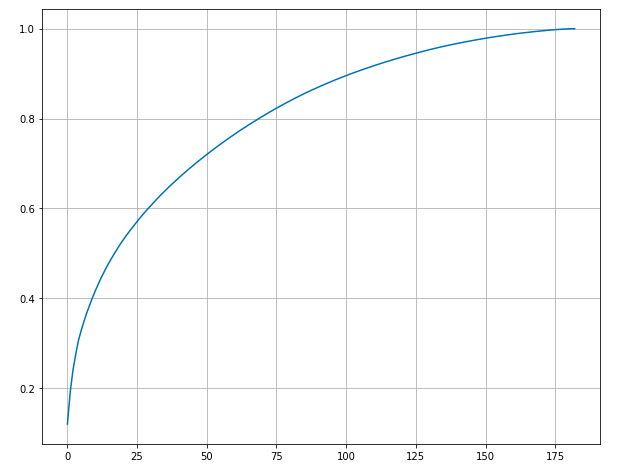
As a rule of thumb, we always want more than 80 percent of the variance. So for this, I think 100 columns will be sufficient.
Then I just apply PCA to my scaled dataset. I got a variance of approx 88 percent which is sufficient to move forward.
So the PCA part is done after this I just map the weights and find the top 3 PCA components.
So in the first component, I find out that the share of cars and vans is increasing like BMW in microcells.
The Second component was tough to understand so i think according to it East Germany are preferably like to own middle-class car as compare to west Germany.
In the third component in PLZ8 region number of cell and building are increasing and also the share of car and mostly the car owner are in 46 to 60 yrs old.
So the PCA part is done now its time for clustering. I used the KMeans clustering algorithm.
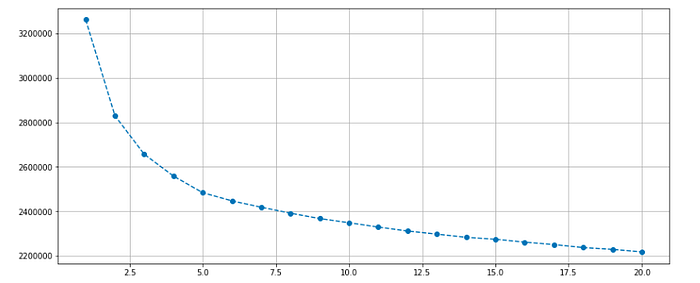
So from the elbow method, it is clear that 5 is the Right Number for clustering.
From clustering, we got 5 clusters and there are two important clusters in which one have very high customer and others have very less number of customers.
Predict customer response rate
So for this part, I really want to be quite manageable and for that, I just remove the all categorical columns and uses the XGBRegressor model for that.
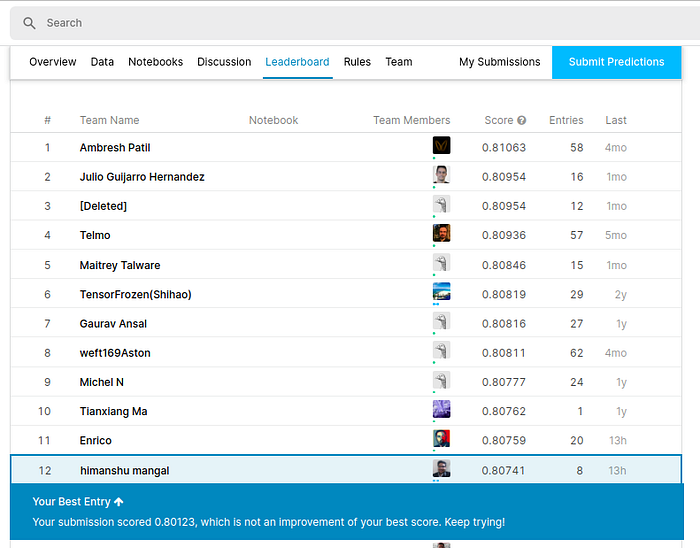
After Applying the XGBRegressor model I got about 80 percent of Area Under the Receiver Operating Characteristic Curve.
After all these, I got 12th rank on Kaggle in-class competitions.
I hope this will help you to understand the Arvato project better
